All Resources
Covid-19 Hotspot dispersion report analysis: Pathing Report with ESRI
Location Lowdown

In order to complete Step 2 you will need to do the following
Step 1
Clean report so that only the first ping seen in the day is reported for each device.
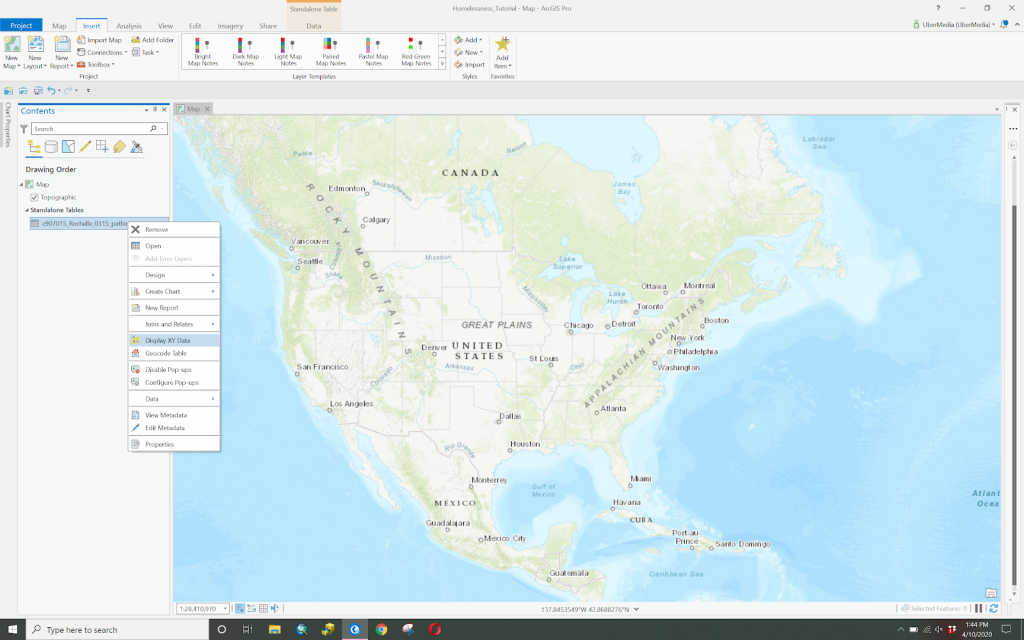
Step 2
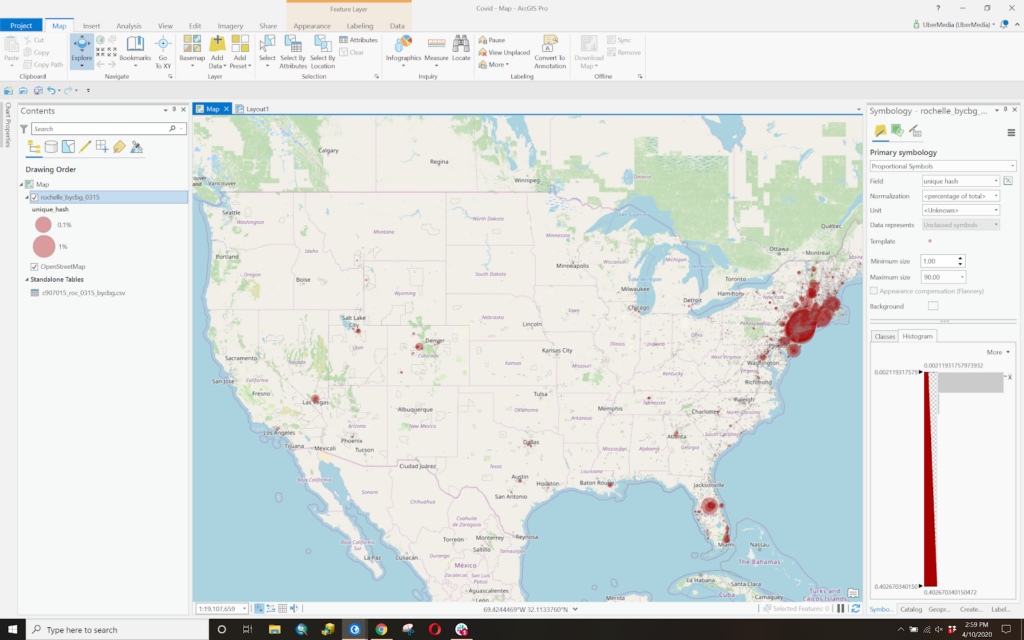
Pull the report into ArcGIS Pro.

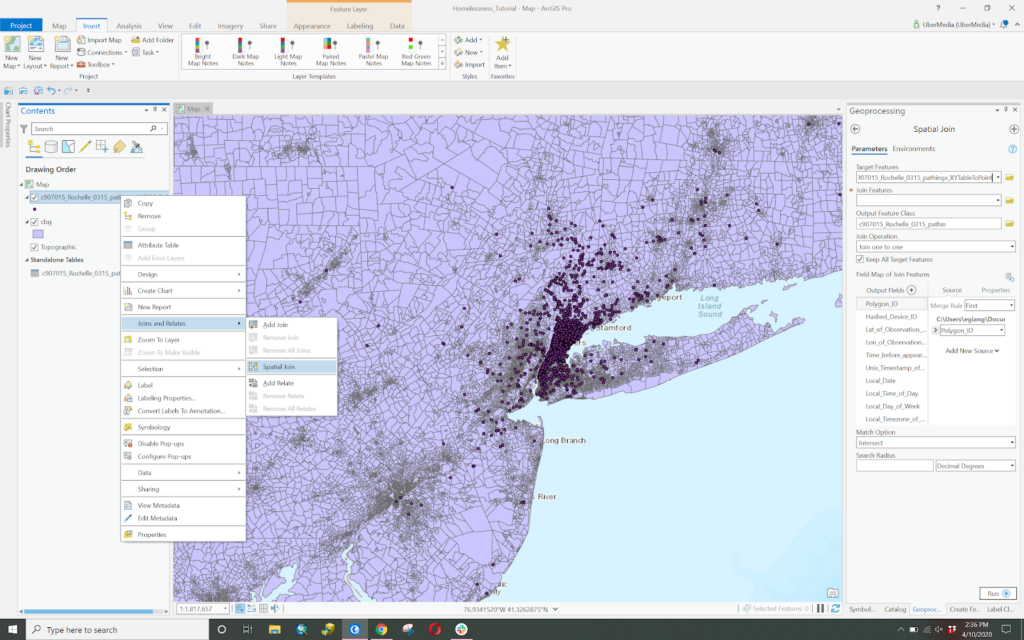
Step 3
Join it with the Census Block Group boundaries and add a column to the Pathing file with the CBG
Step 4
The coordinates fall in Aggregate # of Devices by CBG (we recommend to export the file from ArcGIS Pro and then perform the aggregation)
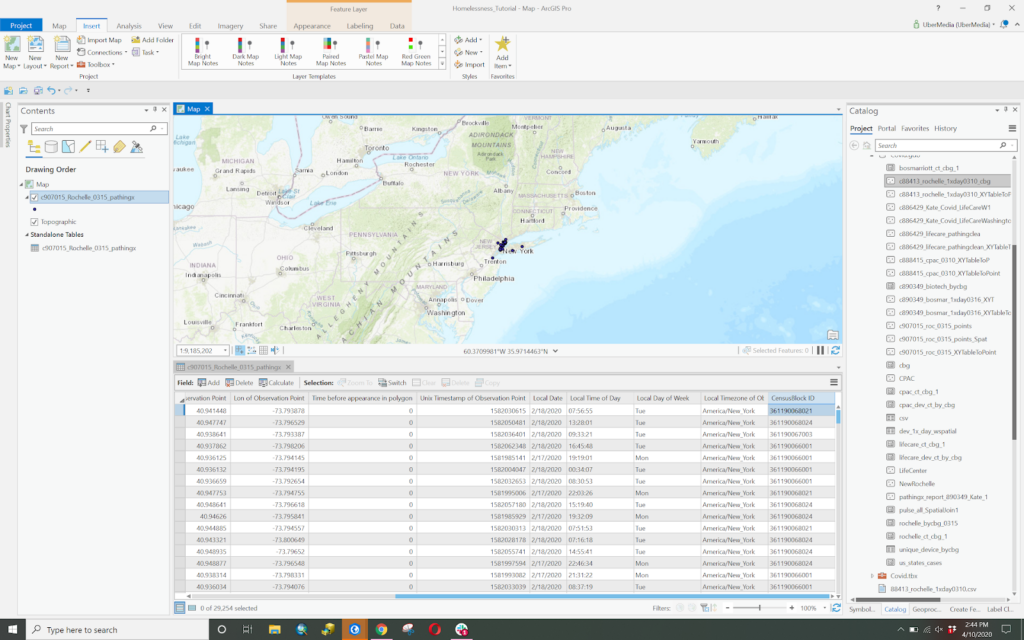
Step 5
Load it back into ArcGIS Pro.
Step 6
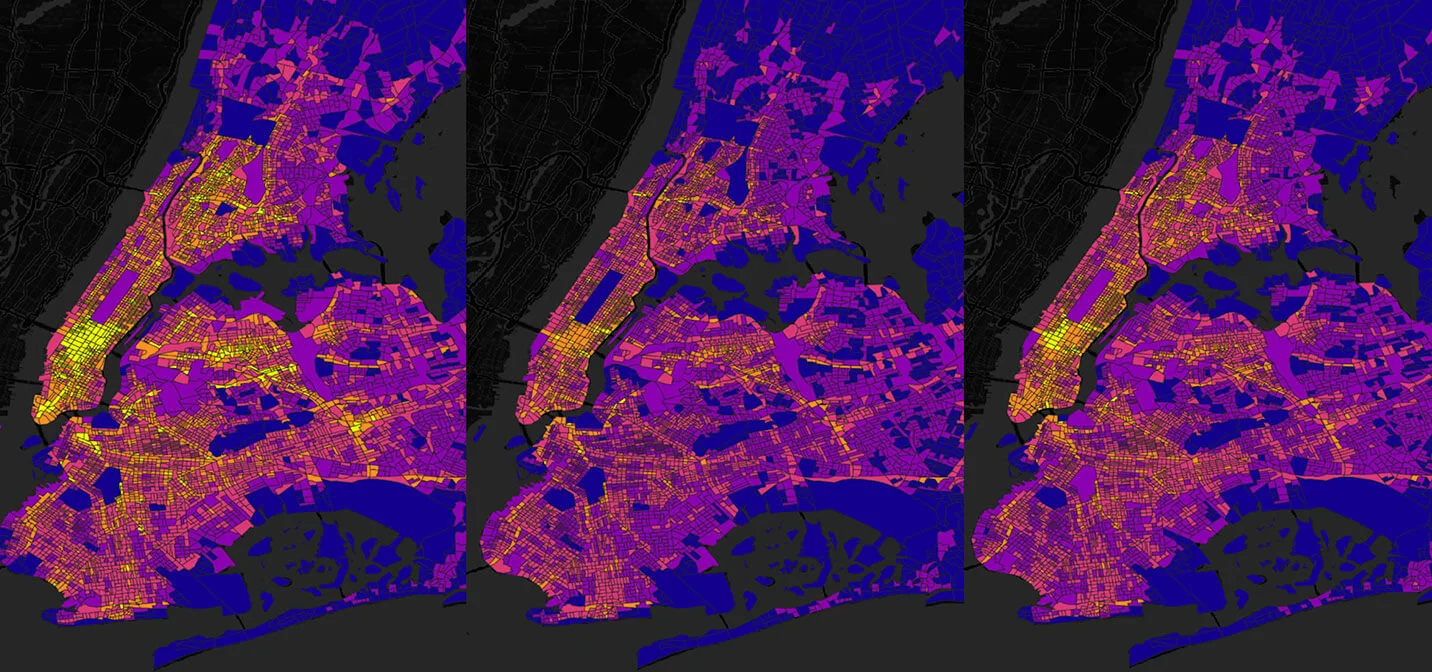
Join with the CBG boundaries again except this time for the visualization.
Near copyright notice and disclaimer: No reproduction or use is permitted without Near’s express written consent.
The Azira Team
2.0
mins read
Share:
share on linkedin
Explore More
Platform and Data
Operational Intelligence
News & Updates
Marketing Intelligence
Marketing & Advertising
Location Lowdown
Data Stories
Culture

SCHEDULE A DEMO
Heading
Get a personalized walkthrough of how Azira turns real-world behavior into measurable results and uncover opportunities tailored to your business.